>07
Performance
“In spite of a degraded economic and geopolitical context, GROUPE IDEC can rely on its essential principles to continue to see growth, in energy and at an international level, with very fine prospects”
Raphaël VALLÉE
Administration and Finance Manager, GROUPE IDEC
2023 Results
After a record year for the Group in 2022, in a context that was nonetheless uncertain, the extremely swift deterioration in financing conditions in 2023 and the collapse of the residential real estate market only had a limited effect on our activities.
Revenues remained close to 500 million Euros and production even saw a slight increase to stand at € 529 M, confirming the sturdiness of the model as an integrated global player in the professional property field and the Group’s resilience in a severely degraded environment.


Consolidated balance sheet
| Dec 2023 | Dec 2022 | |
| Non-current assets | 394,588 | 274,588 |
| Current assets | 333,988 | 333,800 |
| Available cash and cash assets | 67,574 | 98,085 |
| Total Assets | 796,151 | 706,473 |
| Equity capital – Group share | 119,554 | 118,914 |
| Minority interests | 181 | -1,146 |
| Provisions | 14,360 | 15,446 |
| Loans and financial debts | 354,297 | 227,734 |
| Current liabilities | 307,760 | 345,525 |
| Total Liabilities | 796,151 | 706,473 |
NET FINANCIAL LIABILITIES
The net liabilities showed a sharp increase as a result of the Group’s determination to reinvest in its property assets, and also to back growth at an international level and in energy. They stood at € 287 M at the end of December 2023. As a counterpart, the assets rose by over 120 million Euros.
| 2023 | < 1 year | 1 to 5 years | > 5 years | 2022 | |
| Loans and financial debts | 354,297 | 59,651 | 156,107 | 138,540 | 227,734 |
| Available cash | (67,574) | (67,574) | (98,085) | ||
| Net financial liabilities | 286,723 | (7,924) | 156,107 | 138,540 | 129,649 |
Cash flow statement
| Dec 2023 | Dec 2022 | |
| 1/ EXPLOITATION OPERATIONS | ||
| Cash flow from integrated companies | 26,080 | 23,834 |
| Dividends received from the companies, equity method | 3,080 | 3,300 |
| Change in working capital requirements linked to activities | (15,448) | 61,658 |
| Variation in cash position stemming from exploitation operations | 13,712 | 88,793 |
| 2/ INVESTMENT OPERATIONS | ||
| Acquisition of fixed assets | (106,695) | (29,709) |
| Transfers of fixed assets, net of taxes | 9,653 | 702 |
| Incidence of perimeter variations | 5,437 | 5,414 |
| Variation in cash position stemming from investment operations | (91,605) | (23,593) |
| 3/FINANCING OPERATIONS | ||
| Dividends paid | (8,160) | (8,088) |
| Capital increases or decreases in cash | (6,800) | 0 |
| Net loans issued | 61,903 | (30,033) |
| Variation in cash position stemming from financing operations | 46,944 | (38,121) |
| 4/ INCIDENCE OF CONVERSION LOSSES | (109) | (41) |
| NET VARIATION IN CASH POSITION | (31,058) | 27,039 |
| OPENING NET CASH POSITION | 96,740 | 69,702 |
| CLOSING NET CASH POSITION | 65,682 | 96,740 |
INCOME STATEMENT
The EBITDA, the operating income and the net income showed strong growth, reflecting the attention paid to avoiding deterioration of our margins, in spite of the context.
| Dec 2023 | Dec 2022 | |
| Productions & sales for the financial year | 529,218 | 523,723 |
| Operating expenses | (493,642) | (490,121) |
| Miscellaneous operating income and costs | 5,146 | 1,238 |
| EBITDA | 40,722 | 34,840 |
| Net charges to depreciation and provisions | (11,185) | (13,525) |
| Operating result | 29,537 | 21,315 |
| Financial result | (7,843) | (3,627) |
| Exceptional result | (3,621) | (1,356) |
| Pre-tax income | 18,072 | 16,332 |
| Corporate tax | (8,007) | (7,822) |
| Net income of consolidated companies | 10,065 | 8,510 |
| Share of income for entities, equity method | 4,600 | 4,671 |
| Overall net consolidated result | 14,665 | 13,181 |
| Minority interests | (1,152) | (718) |
| Net income (Group share) | 15,817 | 13,899 |
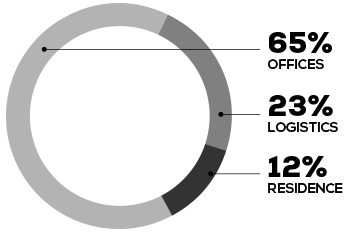
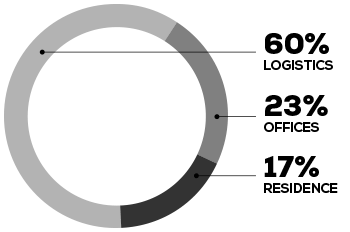
Distribution of production by division
Real estate property
| Net book value | Value of assets | Liabilities | Unrealised capital gains | |
| Real estate property | 301,048 | 370,433 | 203,312 | 69,385 |
| Loan to value | 0.55 |
VALUE OF ASSETS
Unrealised capital gains
Investment funds
In 2023, the group also continued to invest in innovative start-ups centred on renewable energy sources, in particular by acquiring holdings in Heliup (Photovoltaic), Wind My Roof (Wind power), Arverne (Geothermal energy and lithium stripping), and Aura Aero (hybrid aviation).
| Equity held | Action | Convertible bonds | Depreciation | VNC 2023 | VNC 2022 |
| Holding division | 3,330 | (2,275) | 1,055 | 2,286 | |
| International division | 1,078 | 1,078 | 2,155 | ||
| Investment Division | |||||
| Investment funds | 41,687 | 7,769 | (2,206) | 46,850 | 30,321 |
| Other | 1,072 | 1,321 | 0 | 2,393 | 2,509 |
| Total Investment Division | 42,759 | 9,090 | (2,206) | 49,243 | 32,830 |
| 47,167 | 9,090 | (4,881) | 51,375 | 37,272 |
Key indicators
Average staff levels
| Numbers | 2023 | 2022 | Variation | Variation as a % |
| 586 | 531 | 55 | 10% |
Age pyramid
Age pyramid